Atlas
An end-to-end machine learning platform that transforms a decade of real-world user data into a semantically-clustered, embeddings-driven visualization — surfacing latent structure that traditional metadata-based recommendation systems miss entirely.
Tech Stack
- Python
- FastAPI
- PostgreSQL
- OpenAI Embeddings API
- GPT-4o
- UMAP
- HDBSCAN
- scikit-learn
- Next.js
- TypeScript
- Tailwind CSS
Overview
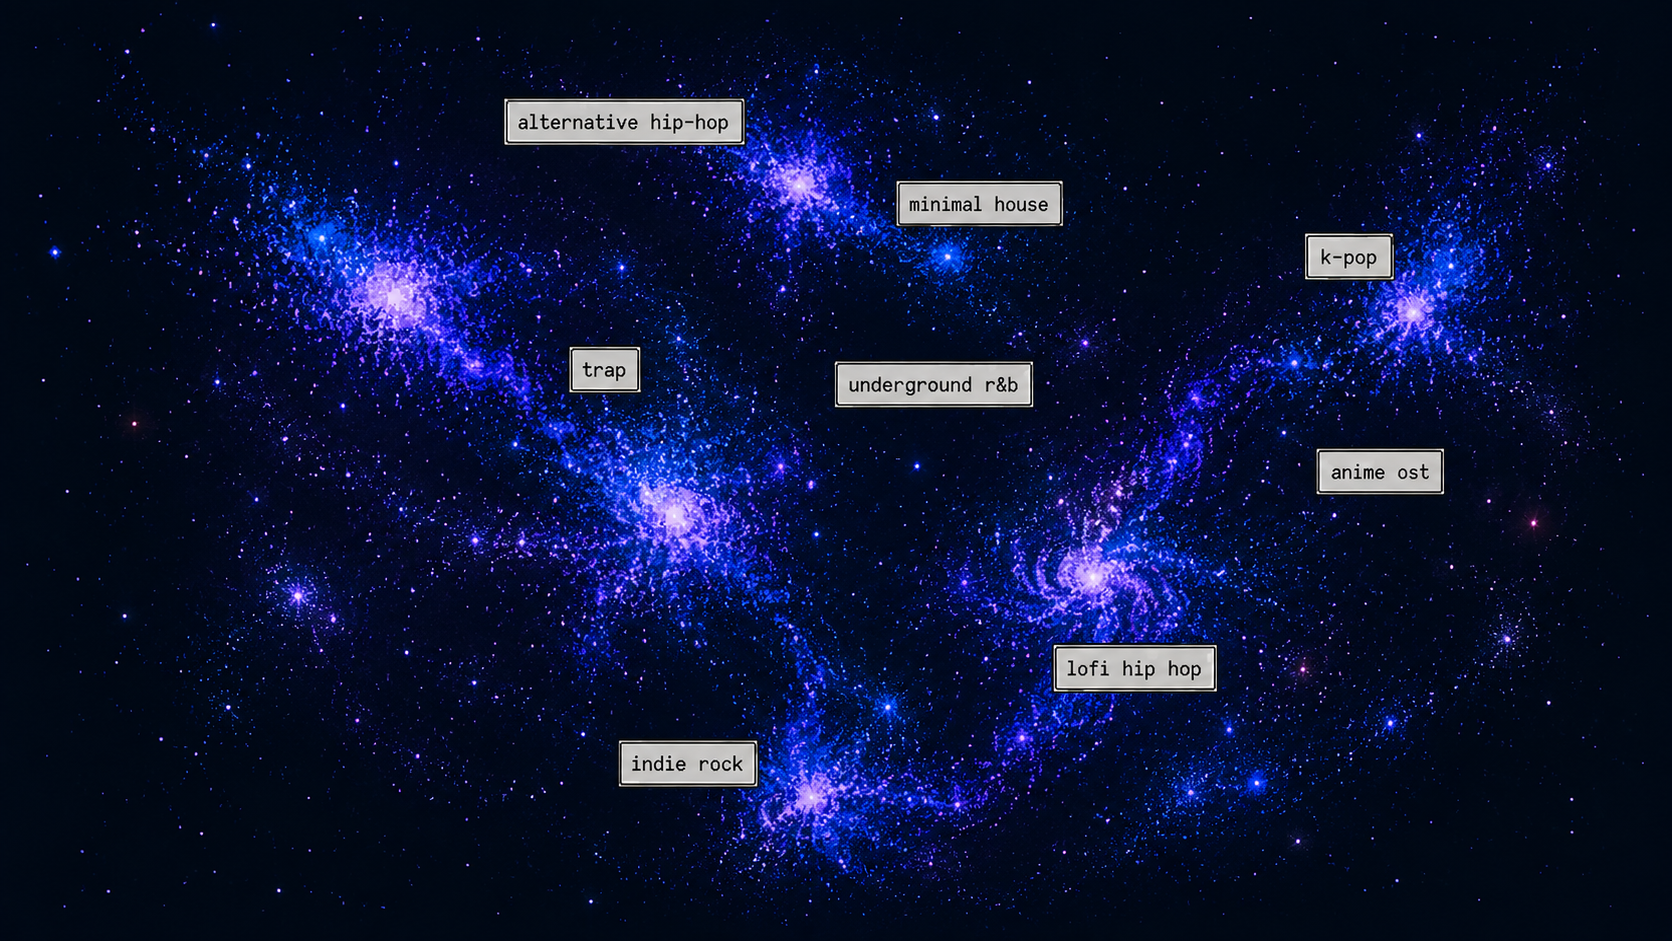
Spotify Atlas visualizes how listening patterns vary across cities and cultures. Using track embeddings and metadata, Atlas surfaces music communities, regional signatures, and taste neighborhoods you can explore interactively.
The Problem
Traditional music recommendation relies on genre tags and audio features — shallow signals that miss the semantic and emotional relationships between tracks. Atlas solves this with an LLM-driven feature engineering pipeline: generating rich natural-language descriptions of each track's emotional character, then leveraging transformer-based embeddings to capture relationships invisible to conventional metadata-based approaches.
What I Built
Atlas is an end-to-end data product that turns millions of songs and listening events into an exploratory map of music.
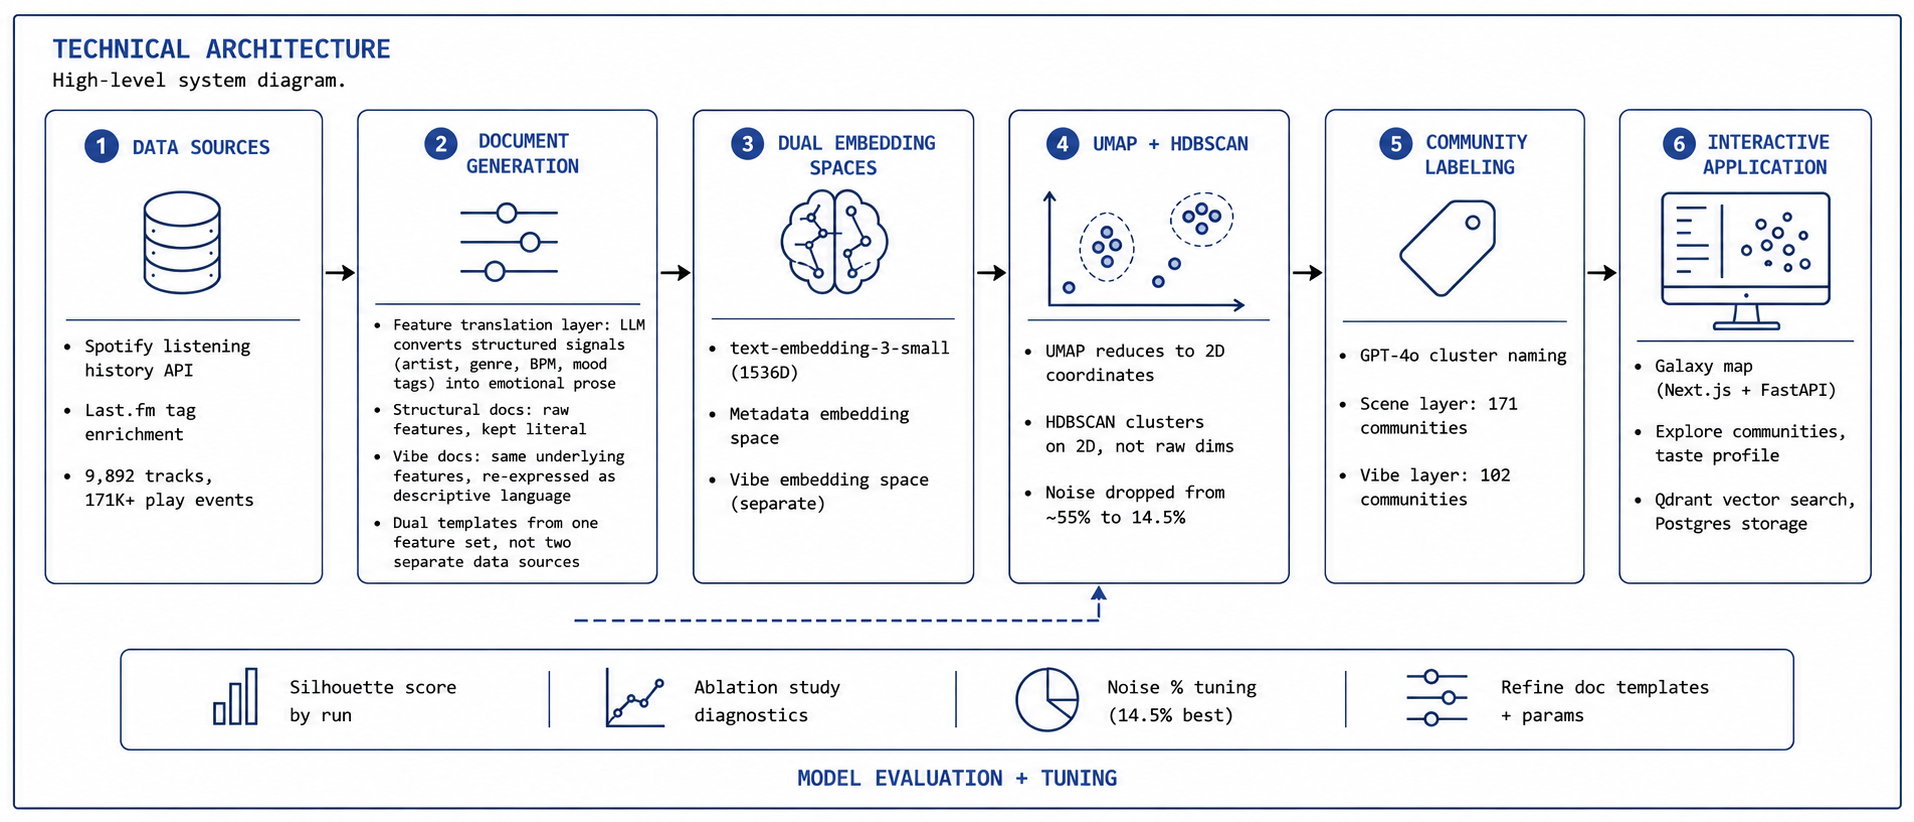
- Designed and implemented a dual-embedding architecture, comparing structured metadata embeddings against LLM-generated natural language embeddings across two independently trained clustering pipelines
- Engineered an unsupervised clustering pipeline (UMAP dimensionality reduction + HDBSCAN density-based clustering) achieving 171 and 102 distinct semantic communities across two embedding spaces — including discovery of a 347-track cross-artist cluster with zero shared metadata, validating that embedding-based similarity captures signal invisible to traditional feature engineering
- Built a time-series anomaly/change-point detection system to segment a decade of behavioral data into statistically distinct eras, with results independently validated against ground-truth life events
- Architected and shipped a full-stack, production-deployed data visualization product: custom canvas-based rendering engine, real-time search, and interactive exploration UI
- Deployed a production ML/data system end-to-end — FastAPI + PostgreSQL on Railway, Next.js/TypeScript on Vercel — serving a live dataset with sub-300ms API response times
Key Features
- Dual embedding-space architecture: comparative visualization of metadata-driven vs. LLM-embedding-driven clustering on identical data
- 273 machine-generated semantic cluster labels via LLM-based naming pipeline with custom prompt engineering and de-duplication logic
- Unsupervised temporal segmentation: statistical change-point detection applied to longitudinal behavioral data
- Custom-computed cohesion metric: cosine-similarity-based cluster quality scoring, validated against cluster density
- Multi-window analytics dashboard with time-series aggregation across variable date ranges
Technical Architecture
High-level system diagram.