CoreAI Market Flare
End-to-end predictive ML system quantifying ZIP-level real estate market hotness using proprietary industry data, XGBoost, and SARIMA forecasting. Awarded 1st Place at 2025 UCI ICS Project Expo.
Tech Stack
- Python
- XGBoost
- Random Forest
- LightGBM
- SARIMA
- K-Means
- SQL
- Streamlit
Overview
CoreAI Market Flare forecasts real estate market "hotness" at the ZIP-code level across California. Built during my UCI Data Science capstone in partnership with a leading real estate data provider, the system won 1st Place at the 2025 UCI ICS Project Expo.
The Problem
Real estate hotness — where demand exceeds supply and homes sell over list price — is difficult to quantify directly. A single "hotness score" hides which underlying market forces are driving it and makes the score hard to trust or explain.
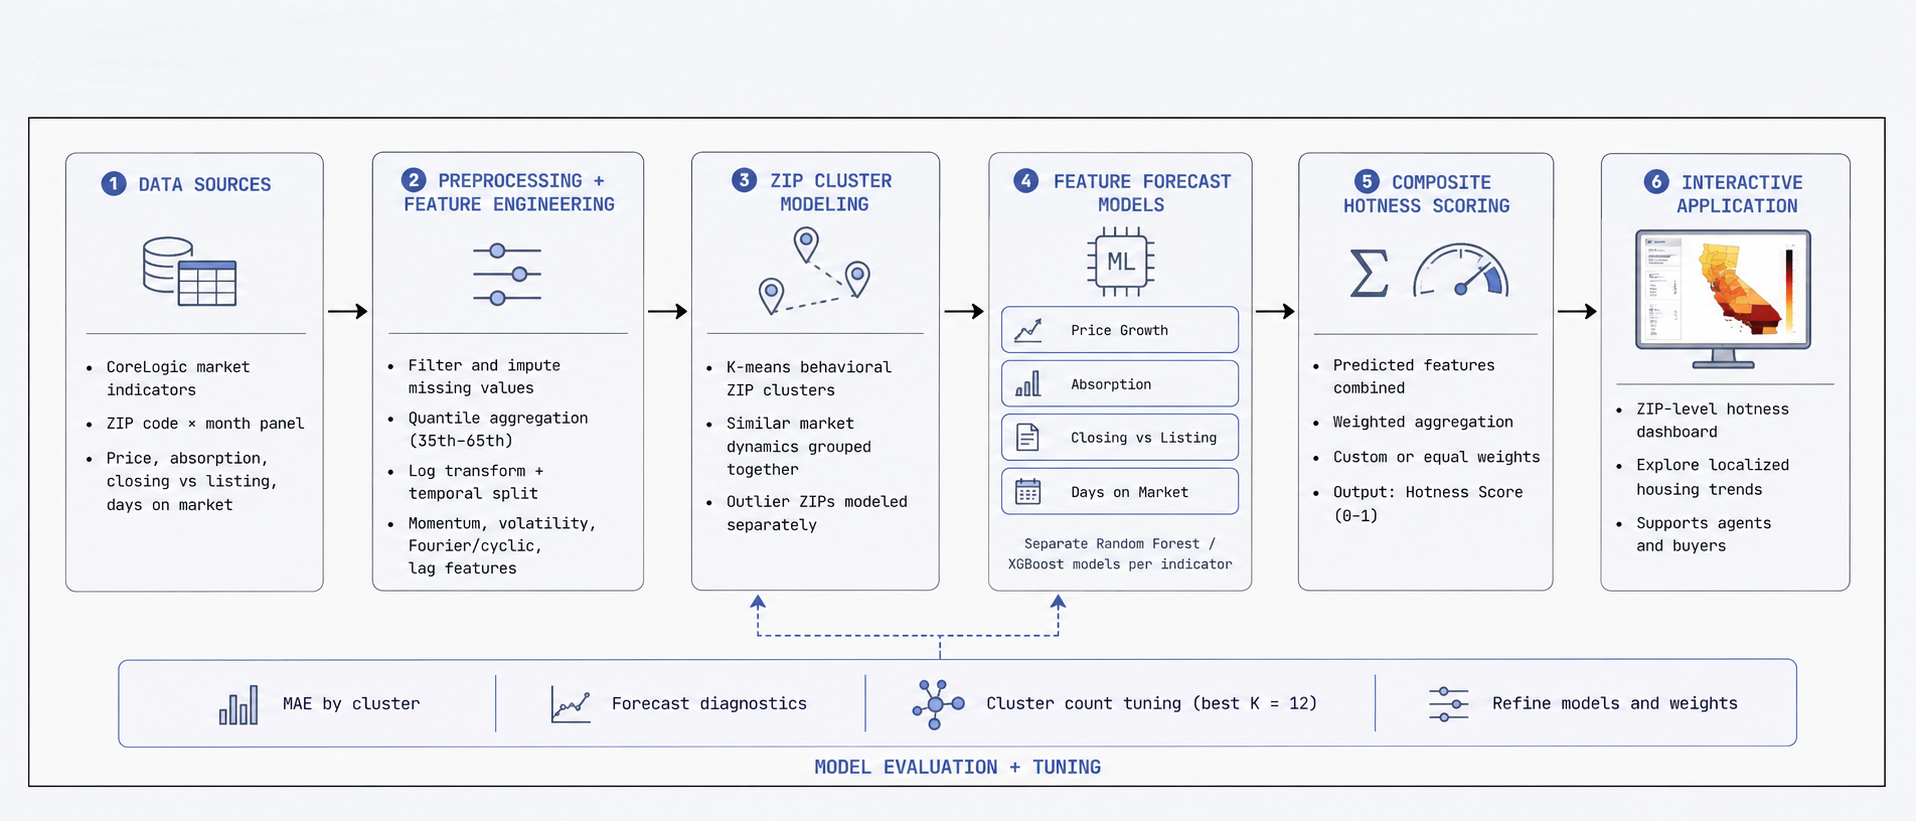
Our approach: instead of predicting hotness directly, we independently forecast the underlying market indicators (Days on Market, Absorption Rate, Offer-to-List Price Ratio) using ZIP-level historical data, then combine those predictions into a single, weighted, explainable Hotness Score.
What I Built
- Engineered 50+ features from raw transaction data (101,462 rows) at the ZIP-code × month level, including momentum, volatility, Fourier/cyclic transforms, and lag features
- Built a K-Means clustering approach (K=12, tuned via MAE) to group behaviorally similar ZIP codes, capturing subtle market patterns lost in broader city/county aggregations
- Trained independent Random Forest and XGBoost models per cluster to forecast three key market indicators 1-6 months ahead: Days on Market, Absorption Rate, and Offer-to-List Price Ratio
- Designed a weighted aggregation layer that combines the three forecasted indicators into a single composite Hotness Score, with user-adjustable weights (custom vs. equal) to let domain experts prioritize specific market dynamics
- Handled erratic ZIP clusters (highly volatile behavior, sharp market shifts, sparse data) by modeling outliers separately and manually adjusting cluster assignments
Key Features
- Modular forecasting architecture: independently predicts each market indicator rather than a black-box hotness score, tracing exactly how each factor contributes
- Cluster-aware modeling: ZIP codes grouped by K-Means (K=12) into behaviorally similar segments, with lag-based temporal panels capturing time-based patterns
- Ensemble forecasting: Random Forest + XGBoost per cluster per indicator, validated with MAE, RMSE, R², and SMAPE
- Customizable weighted scoring: users can set custom or equal weights across indicators to tailor the composite Hotness Score to their needs
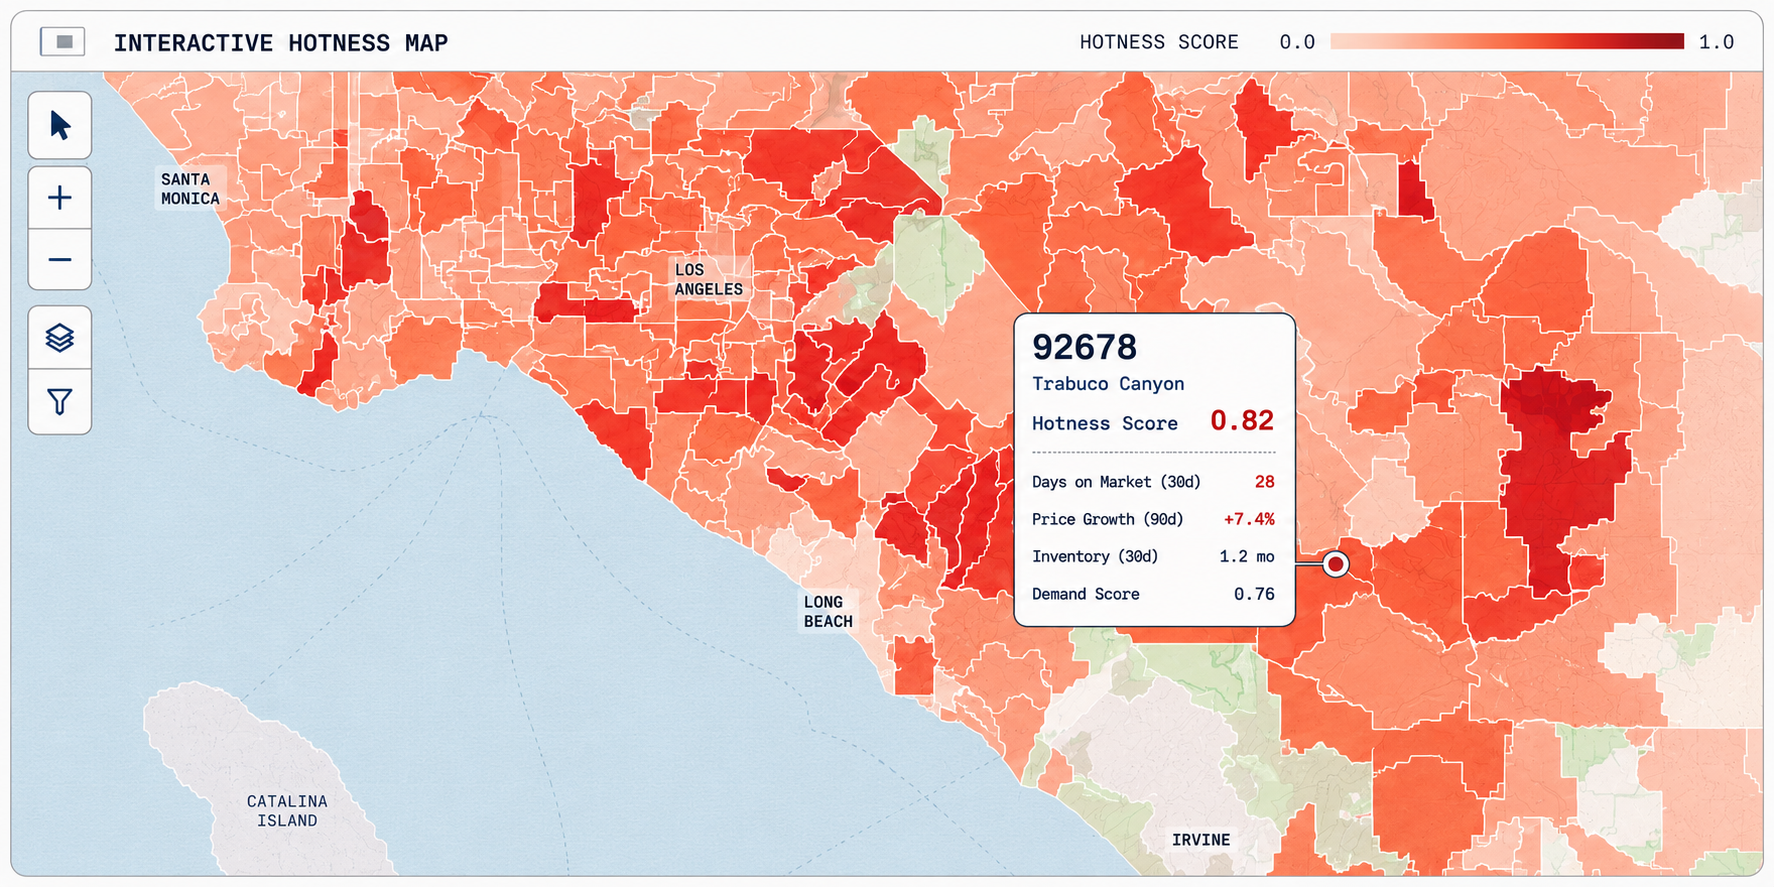
- Interactive Streamlit dashboard: choropleth map visualization of ZIP-level hotness across California with city/county/postal code search
- Team capstone: built with 3 teammates and industry/UCI mentors; 1st Place, 2025 UCI ICS Project Expo
Technical Architecture
High-level system diagram.